
Thinking about a raise or exit in 2025? In SaaS, efficiency wins. Growth still matters—but buyers and investors pay up for durable revenue, strong retention, and real cash-flow discipline.
In this guide, you’ll learn the metrics that actually move multiples: ARR quality, growth and NDR, CAC payback and LTV/CAC, the Rule of 40, plus the red flags that compress value. Use these to benchmark your numbers and position your company for a better outcome—whether you’re testing the market or prepping for diligence.
Understanding what drives SaaS multiples helps founders maximize exit value. Smart investors focus on specific metrics that predict long-term success. These measurements separate winning investments from risky bets.
Where Multiples Stand Now
The SaaS market has changed a lot since its big peak, and now companies are valued more carefully. Instead of chasing fast growth at any cost, investors now look for businesses that can grow steadily while also making money. This new normal means investors reward companies that show strong customers, smart spending, and a clear path to profit.
Market Recovery and New Normal Metrics
Private SaaS companies typically trade at 3x-10x ARR multiples. Public companies command higher ranges between 7x-12x revenue. The median multiple has stabilized at approximately 6.7x as of August 2025.
Recovery trends show gradual improvement from 2022-2023 lows. Q3 2024 data reveals slight upticks in valuation multiples. However, the market remains selective about premium valuations.
Public SaaS businesses maintain advantages over private counterparts. Greater liquidity drives higher investor demand. Market transparency also supports sustained multiple expansion for quality companies.
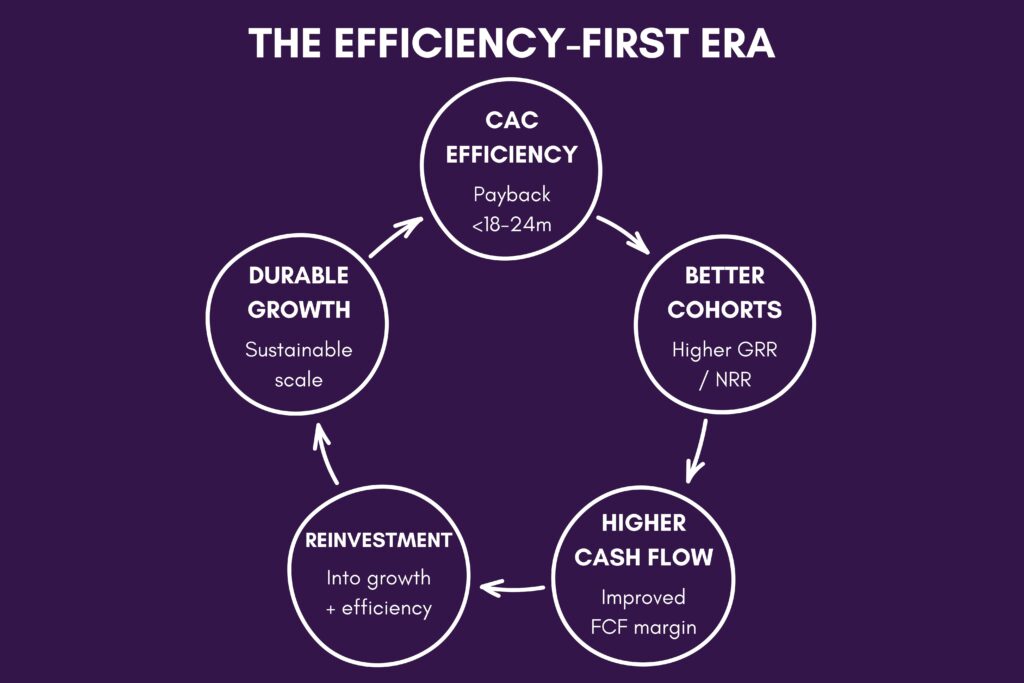
Investors abandoned the growth-at-all-costs mentality permanently. Higher interest rates changed capital allocation priorities. Profitability now weighs equally with growth rates in investment decisions.
Quality customer acquisition replaced quantity-focused strategies. CAC efficiency determines which companies attract premium valuations. Sustainable growth models outperform rapid expansion approaches.
The new environment rewards unit economics optimization. Companies must demonstrate clear paths to profitability. Cash flow generation capabilities influence investor interest significantly.
The Essential Financial Metrics Investors Prioritize
One of the most important numbers for a SaaS company is called Annual Recurring Revenue (ARR). This shows how much steady money comes in from customers every year. Strong ARR makes a company more valuable because it proves people keep paying for the product.
But it’s not just about how big the ARR number is. Investors also look at where the money comes from, how long customer contracts last, and whether too much depends on a single client. A company with many loyal customers and long-term deals is seen as safer and worth more.
ARR: The Foundation of SaaS Valuation
ARR multiples serve as the primary valuation benchmark across industries, and investors rely on them to judge long-term stability. High-quality ARR includes predictable, contracted recurring revenue streams, and long-term contracts with automatic renewals command premium multiples.
Customer concentration affects ARR quality substantially. Revenue concentration above 20% from single customers creates risk, while diversified customer bases support higher valuation multiples consistently.
Contract terms strongly influence how investors view ARR sustainability. Multi-year agreements with built-in price increases strengthen valuations, while month-to-month subscriptions face valuation discounts due to churn risks.
Growth Rate Analysis
Growing revenue is still very important for SaaS companies. Investors want to see steady growth that can last for years, not just short bursts. The best kind of growth happens when costs go down while profits and customer value go up.
Strong growth also comes from keeping current customers happy and getting them to spend more over time. This makes a business less dependent on finding new buyers, which investors like. When monthly revenue grows in a steady way instead of bouncing up and down, investors feel more confident about the company’s future.
Top 5 ARR Red Flags Investors Watch For
- High customer concentration exceeding 20% from single clients creates dependency risks, which most investors view as a major warning sign.
- Declining growth rates without corresponding profitability improvements signal market saturation.
- Inconsistent monthly patterns in recurring revenue indicate poor subscription management.
- Low contract renewal rates below 85% suggest product-market fit issues.
- Heavy dependence on one-time implementation fees inflates recurring revenue metrics and makes investors question true sustainability.
Customer-Centric Metrics That Drive Value
Looking at customers is one of the best ways to see if a SaaS company will succeed. Numbers like how many customers stay and how much more they spend over time show real strength. These signs often tell more about the future than just looking at money today.
One key measure is called Net Dollar Retention, which shows if current customers are buying more. Another is churn rate, which tells how many customers leave. Lower churn and higher retention make a company stronger and more valuable.
Net Dollar Retention: The Ultimate Growth Indicator
NDR above 120% commands premium SaaS multiples consistently. This metric combines customer retention with expansion revenue. Companies achieving 125%+ NDR often receive 10x+ ARR multiples.
Net Dollar Retention exceeding 100% indicates existing customers generate growth. Revenue expansion from current customers costs less than new acquisition. High NDR reduces dependence on expensive customer acquisition strategies.
Expansion revenue sources include upsells, cross-sells, and usage-based pricing. Product-led growth models naturally drive higher NDR performance. Successful companies generate 60-80% of growth from existing customers.
Customer Acquisition Economics
CAC payback periods determine investment attractiveness across company stages. Investors expect payback within 12-24 months for most SaaS businesses. Longer payback periods require exceptional customer lifetime value.
LTV:CAC ratios above 3:1 indicate healthy unit economics. Premium valuations require ratios exceeding 5:1 consistently. These ratios must improve over time as companies mature.
Organic acquisition channels support higher valuations than paid strategies. Word-of-mouth referrals and product-led growth reduce CAC expenses. Diversified acquisition channels minimize single-point-of-failure risks.
| Company Size | NDR Target | CAC Payback | Churn Rate (Annual) |
| <$1M ARR | >110% | <12 months | <15% |
| $1M-$10M | >115% | <18 months | <10% |
| $10M-$50M | >120% | <24 months | <8% |
| >$50M | >125% | <30 months | <5% |
The Rule of 40 and Profitability Metrics
The Rule of 40 has become the definitive SaaS efficiency measurement. This metric combines revenue growth percentage with EBITDA margin percentage. Scores above 40% typically receive premium valuation multiples.
Understanding Rule of 40 in 2025
Rule of 40 calculation adds growth rate to profit margin percentages. A company growing 30% with 15% EBITDA margins scores 45%. This balanced approach rewards efficient growth over pure expansion.
Companies scoring above 60% often command 10x+ ARR multiples. Scores below 20% face significant valuation discounts in today’s market. The metric has evolved into the primary investor screening tool.
Post-pandemic market conditions elevated Rule of 40 importance significantly. Investors prioritize companies demonstrating operational discipline. Growth without profitability improvement receives little premium valuation.
Profitability Pathways
Gross margins above 80% support premium SaaS valuations consistently. High margins indicate pricing power and operational efficiency. Software businesses with lower margins face valuation challenges.
Operating leverage improves as companies scale their operations. Fixed costs spread across larger revenue bases increase profitability. Scalable business models demonstrate clear paths to margin expansion.
Cash flow generation capabilities influence investor confidence substantially. Positive operating cash flow reduces dilution risks. Free cash flow positive companies command higher valuation multiples.
Market Position and Competitive Moats
A company’s market size is important because it shows how much room there is to grow. Bigger markets mean more customers to reach and more chances to increase revenue. When a business operates in a small market, its growth potential is limited, no matter how strong the product is.
Winning and keeping a good share of a large market makes a company more valuable. This strength creates long-term opportunities and builds trust with investors who want safe, lasting returns. Competitive advantages—like strong brand recognition, loyal customers, or hard-to-copy technology—help the company stay ahead of rivals.Total Addressable Market size influences investor interest and valuation multiples. Large markets support sustained growth and expansion opportunities. Market share capture potential drives long-term value creation.
Defensibility Factors
Network effects create powerful competitive advantages for SaaS companies. User value increases as more customers join the platform. These effects build natural barriers against competitor threats.
Data advantages strengthen over time as customer usage grows. Machine learning capabilities improve with larger datasets. AI-powered features become more valuable with increased user interactions.
Integration complexity creates switching costs for established customers. Deep API integrations with customer systems increase retention rates. Complex implementations reduce churn probability significantly.
Market Opportunity Assessment
TAM expansion potential supports higher valuation multiples over time. Adjacent market opportunities provide growth runway beyond core segments. International expansion doubles or triples addressable market sizes.
Market share concentration affects competitive positioning and pricing power. Fragmented markets offer consolidation opportunities through acquisitions. Dominant positions in niche segments command premium valuations.
Platform strategies expand TAM through ecosystem development. Third-party integrations and API partnerships create additional revenue streams. Marketplace models generate network effects and increased customer stickiness.
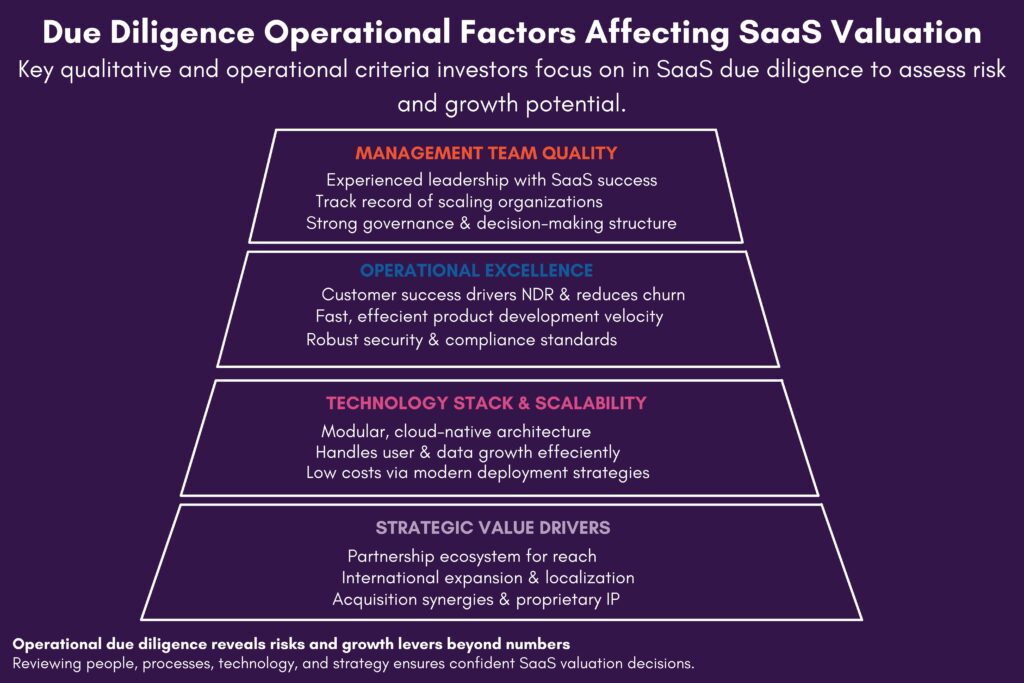
Due Diligence Factors Beyond the Numbers
Management team quality significantly influences investor decisions and valuations. Experienced leadership with prior SaaS exits commands higher multiples. Track records of building scalable organizations reduce execution risks.
Operational Excellence Indicators
Customer success capabilities directly impact Net Dollar Retention performance. Strong support organizations reduce churn rates and drive expansion revenue. NPS scores above 50 indicate exceptional customer satisfaction.
Product development velocity determines competitive positioning over time. Engineering productivity metrics reveal organizational efficiency levels. Security certifications and compliance standards support enterprise customer acquisition.
Technology stack scalability influences long-term operational costs and capabilities. Modern architectures support rapid feature development and deployment. Cloud-native designs reduce infrastructure complexity and expenses.
Strategic Value Drivers
Partnership ecosystems expand market reach without proportional customer acquisition costs. Integration partnerships with established platforms accelerate customer adoption. Channel partnerships provide scalable distribution mechanisms.
International expansion roadmaps multiply total addressable market opportunities. Localization strategies support premium pricing in different regions. Global operations reduce dependence on single geographic markets.
Acquisition synergies create additional value beyond standalone SaaS metrics. Strategic buyers often pay premium multiples for complementary capabilities. IP advantages and proprietary technology strengthen acquisition attractiveness.
Key Takeaways for Maximizing SaaS Valuation
SaaS valuation in 2025 rewards balanced growth and operational efficiency. Higher Rule of 40 scores correlate with premium multiples, though growth remains the primary driver. Customer-centric metrics like NDR predict sustainable value creation.
Financial metrics provide the foundation, but operational excellence drives valuation premiums. Strong management teams with proven track records reduce investor risk perceptions. Market positioning and competitive advantages support long-term value creation.
Successful SaaS companies demonstrate clear paths to profitability while maintaining growth. Unit economics optimization creates sustainable competitive advantages. Customer acquisition efficiency determines capital requirements and dilution risks.
Due diligence extends far beyond financial performance in today’s market. Technology scalability, security standards, and partnership ecosystems influence investor interest. Strategic value creation opportunities support acquisition premium multiples.
Ready to maximize your SaaS valuation? Bookman Capital specializes in helping SaaS founders navigate complex valuations and successful exits. Our team of experienced advisors understands what investors truly value in today’s market. Contact Bookman Capital today at bookmancapital.io/ to schedule your confidential valuation consultation and discover how to position your SaaS business for maximum value.
Sources: