
Any financing or exit begins with one question: “What is this business worth?” Buyers do not pay for promises. They pay for future cash.
Discounted cash flow, or DCF, gives a direct answer. It forecasts the cash your company will generate. It then discounts those cash flows back to today at a rate that reflects risk and time. The result is a present value for the whole business.
DCF feels different from simple pricing. It starts with your drivers, not with someone else’s multiple. It shows how retention, margin, and reinvestment turn into value.
In this article, you will see where DCF began. You will see how the model works today. You will learn when DCF wins and when it does not. You will leave with a checklist you can use before your next investor call.
From Classroom Insight to Deal Room Standard
DCF did not start in venture circles. The roots sit in early work on present value. Present value connects money today with money tomorrow.
Irving Fisher described the math behind present value in the early nineteen hundreds. His work explained why a dollar next year is worth less than a dollar today. Time and opportunity cost cause the gap.
John Burr Williams turned that idea into a valuation method in 1938. He argued that the value of any asset equals the present value of its future cash. He applied the logic to dividends and to business cash flows.
Corporate teams adopted the method during the second half of the century. Finance groups used it to decide on projects and on acquisitions. Banks and advisors used it to test fairness in transactions.
Software took DCF from theory to daily use. Spreadsheets made long models fast to build. Scenario analysis became a regular part of review meetings.
This history still matters. Rates and risk premiums change over time. The discount rate that you choose must reflect current conditions.
Inside the Model: Parts That Move the Number
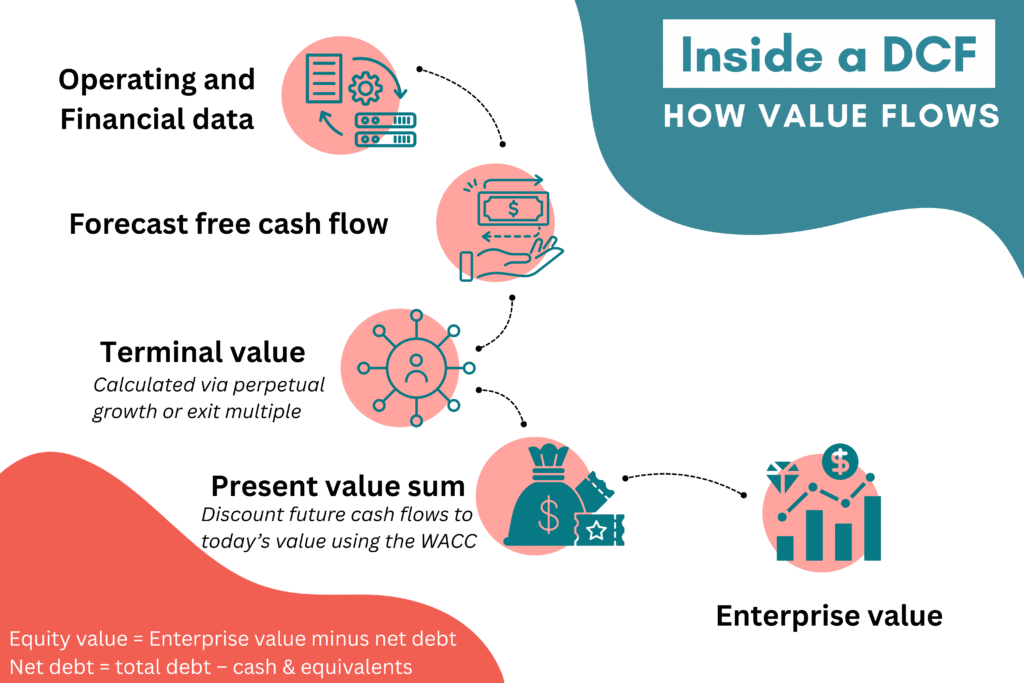
A DCF has three building blocks. You forecast free cash flow for several years. You choose a discount rate that reflects the risk of those flows. You estimate a terminal value for cash beyond the forecast.
Unlevered free cash flow is the most common input. You start with operating profit after tax. You add back non-cash charges. You subtract capital spending. You adjust for the change in working capital.
The discount rate is the weighted average cost of capital. WACC blends the cost of equity and the cost of debt. The weights reflect a target capital structure. The inputs must reflect the currency and inflation of the model.
You can write WACC in one line. WACC equals E divided by V times the cost of equity plus D divided by V times the cost of debt times one minus the tax rate. E is equity value. D is the debt value. V is the sum of equity and debt.
The cost of equity depends on a risk-free rate and an equity risk premium. A beta scales the premium to the business risk. The cost of debt reflects current borrowing terms and the tax shield.
Terminal value captures cash after the explicit forecast. You can use a perpetual growth approach. You can also use an exit multiple on a final year metric. The two methods need to be consistent with the model design.
Terminal value often represents most of the total value. Many real models land near a range of sixty to eighty percent. The exact share depends on growth, margins, and the length of the forecast.
Small changes in key inputs can move the result. A change of twenty-five to fifty basis points in WACC can shift enterprise value in a meaningful way. A change of one-half point in perpetual growth can also move the output by double digits.
The current rate backdrop makes discipline important. The risk-free rate in 2025 stands above levels seen in 2020 and 2021. A model that uses old inputs will not survive diligence.
Choose the Right Lens: Intrinsic Value and Market Pricing
Valuation uses three main lenses. One lens is discounted cash flow. One lens uses trading multiples from public peers. One lens uses prices from prior control deals.
Each lens answers a different question. DCF asks what the stream of cash is worth today. Trading multiples ask what markets pay for similar earnings or revenue. Precedent transactions ask what buyers paid for similar companies.
Use the table below to compare the methods.
| Method | What it measures | Strengths | Watch outs | Best use cases |
| Discounted cash flow | Present value of future free cash flows | Ties value to drivers and time | Sensitive to discount rate and terminal value | Businesses with stable cohorts and clear investment plans |
| Trading multiples | Market prices of similar public companies | Simple to apply and easy to explain | Can hide margin and reinvestment differences | Early-stage or volatile firms with limited cash visibility |
| Precedent transactions | Prices paid in comparable control deals | Captures control premiums and synergy views | Small or dated samples can mislead | Strategic sale processes in defined sectors |
Use DCF to explain value. Use multiples and precedents to anchor the negotiation range.
Seven Signals That DCF Is The Right Tool
- You have at least twenty-four to thirty-six months of monthly cash and cohort data.
- Customer retention is stable and churn is measurable by cohort.
- Revenue is contracted or subscription-based with clear renewal timing.
- Unit economics are tracked and verified at the product or customer level.
- A target capital structure is realistic for the business and the sector.
- Current inputs exist for the risk-free rate, the equity premium, beta, and the cost of debt.
- The decision requires scenario analysis beyond headline comparable multiples.
When these signals are present, DCF adds clarity. The model links drivers to value. The outputs support a defendable story in meetings.
When the signals are missing, pricing methods are more helpful. Early-stage firms have limited cash history. Rapid pivots change drivers in ways a model cannot capture. In those cases, peers and deal comps set expectations.
Build a 2025 Ready DCF: Inputs, Scenarios, and Terminal Value
Start with clean financials. Use the most recent audited or reviewed statements. Reconcile the model to the statement of cash flows.
Pull current market inputs. Use the current ten-year Treasury yield for the risk-free rate. Use a recent equity risk premium for the market you are modeling. Document every source and capture the date in the file.
Estimate a realistic capital structure. Set a target leverage that fits the sector and the business risk. Measure the cost of debt from current terms. Apply the tax rate that reflects where the company pays taxes.
Keep definitions consistent. Use unlevered free cash flow with WACC. Use levered free cash flow with a cost of equity. Do not mix the two in one model.
Build three scenarios. Create a base case that matches current trends. Create a bear case that reflects a credible downside. Create a bull case that reflects credible upside.
Test sensitivity to key inputs. Move WACC up and down by fifty to one hundred basis points. Move terminal growth by small steps around a realistic long-run rate. Move churn, payback, and gross margin by realistic increments.
Treat terminal value with care. Calculate it with both the perpetual method and the exit multiple method. Compare the results. If the two values differ by more than twenty to twenty-five percent, review the assumptions.
Explain the logic behind the terminal value in plain words. Reference the long-run growth of the sector. Reference market size limits and the competitive landscape. Show how reinvestment supports the implied growth.
Check the share of value that comes from the terminal period. If it exceeds about three-quarters of the total value, consider a longer explicit forecast. A longer forecast can reduce reliance on the terminal number.
Record your work. Add an assumptions page that lists every input, source, and date. Add a short memo that states the model scope, the driver tree, and the valuation range.
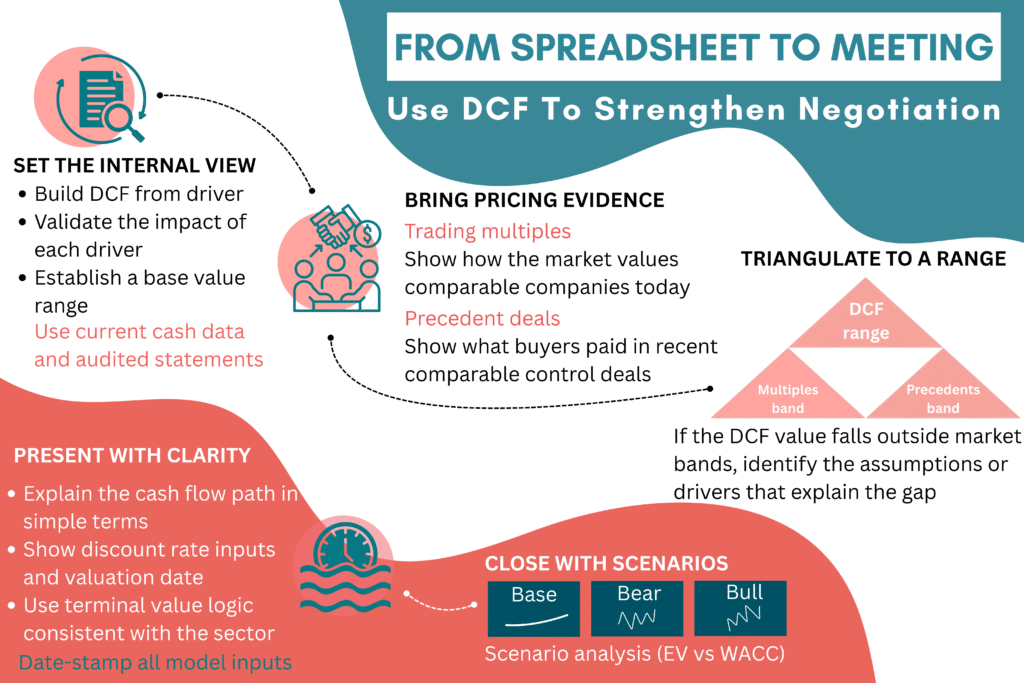
From Spreadsheet to Meeting: Use DCF To Strengthen Negotiation
Use DCF to set the internal view of value. The model shows which drivers matter most. The model shows how much each driver moves the outcome.
Bring pricing evidence to the table as well. Trading multiples show where markets are today. Precedent deals show what buyers recently paid.
Triangulate to a range. Ask whether the DCF result sits within the band that peers and deals suggest. If it does not, find the driver that explains the gap. Adjust the plan or adjust expectations before the meeting.
Use clear language when you present. State the cash flow path in simple terms. State the discount rate inputs and the date you pulled them. State the terminal logic and the reason it fits the sector.
Close with the scenarios. Show the base, the bear, and the bull. Show the sensitivity to WACC and to terminal growth. Invite the other side to focus on drivers, not on one number.
Answers to Common DCF Questions
Who laid the groundwork for DCF?
Economists described present value in the early nineteen hundreds. Irving Fisher explained the time value of money. John Burr Williams applied present value to security and business valuation in 1938. Their work became standard in corporate finance. Spreadsheet tools later made DCF common in deals.
When is DCF better than revenue or EBITDA multiples?
DCF is better when cash flows are predictable. DCF is better when you have reliable cohort data and stable unit economics. DCF is better when you need to test scenarios that pricing methods cannot handle. It also fits capital intensive plans with staged investments. It works well when contracts or subscriptions provide clear visibility.
Why does the terminal value make up so much of the result?
Terminal value represents all cash after the explicit forecast. Most models only forecast five to ten years. The remaining years still create cash. That block often accounts for most of the present value. The share falls when you extend the forecast or slow long run growth.
How do 2025 interest rates affect the output?
Higher risk free rates raise WACC. A higher WACC lowers present value. A model that uses stale rate inputs will overstate the value. Equity risk premiums and credit spreads also change WACC. Date stamp your inputs and refresh them on a regular basis.
Do investors still use DCF for AI companies?
Venture investors often start with revenue multiples. Strategic buyers often review DCF during diligence. DCF helps test growth and synergy claims even when pricing sets the first anchor. Venture teams lean on multiples because early cash data is thin. Buyers use DCF to size synergies and capex needs.
Your Next Step
DCF links price to cash, time, and risk. It explains value in a way that survives tough questions.
You need a valuation that holds up. Bookman Capital reviews your drivers, discount rate, and terminal value using current market data. You get a clear range and next steps.
Get a free valuation and a confidential review. Connect with verified buyers when you are ready to sell. Work with a team trusted by hundreds of founders. Visit bookmancapital.io/ and contact the team today. We keep your information private. Start your review this week and enter your next meeting ready. Bring recent financials and your cohort data. Leave with a short action plan you can share with your board.
Sources: