
Most SaaS deals start with the same question: which methods do bankers trust for banking valuation? Picture a founder who gets a late note from a strategic buyer asking for a price range before a board prep call the next day. The CFO exports ARR, net revenue retention, and gross margin, then opens the data room for the banker. The banker builds a tight peer list for trading comps, pulls two recent transactions with matching retention bands, and runs a quick discounted cash flow that includes AI serving costs. The team now sees a comps ceiling, a deals floor, and a DCF midpoint that the board can defend.
This article shows the exact playbook step by step. You will learn when bankers use trading comps, when they lean on precedent deals, and when a DCF carries more weight. You will see how to choose peers, how to screen transactions, and how to set realistic inputs for cash flow. You will leave with a checklist to present a one-slide banking valuation range that stands up in a real meeting.
The Banker Shortlist That Sets Value
Bankers rely on three core methods for SaaS banking valuation because each method answers a distinct question. Comparable company analysis shows where the market prices similar software businesses today. Precedent transactions show what buyers actually paid for close matches in recent periods. Discounted cash flow shows what long term cash creation supports as a defendable value today.
Analysts begin with comparable public software companies that match size and model. Teams group peers by horizontal software, vertical software, and infrastructure because each group trades at different multiples in 2025. That segmentation shapes banking valuation ranges before any negotiation starts.
Bankers check the inputs that move value first. Required inputs include ARR, net revenue retention, gross margin, Rule of 40, and growth path. Clean inputs improve comps selection, speed decisions, and produce tighter banking valuation outputs.
Table: Banker Methods at a Glance
| Method | Best use | Pros | Cons | Typical inputs | Banker use case |
| Trading comps | Any stage with public peers | Fast view and transparent math | Public liquidity premium vs private | ARR growth, NRR, gross margin, Rule of 40 | First pass range from true peers. |
| Precedent transactions | Market tested price for similar assets | Reflects buyer behavior and synergies | Sparse data and process noise | Deal multiple, buyer type, scale, timing | Calibrate to recent transactions. |
| Discounted cash flow | Later stage with stable visibility | Cash based and scenario friendly | Sensitive to discount rate and terminal value | WACC, churn, expansion, margin path | Cross check and base case support. |
Banking valuation works best when each method plays its role. The comps range anchors conversations to visible prices. The deals range reflects actual outcomes with real buyers and specific integration stories. The DCF checks whether implied cash creation supports the range over time.
Trading Comps That Price SaaS in 2025
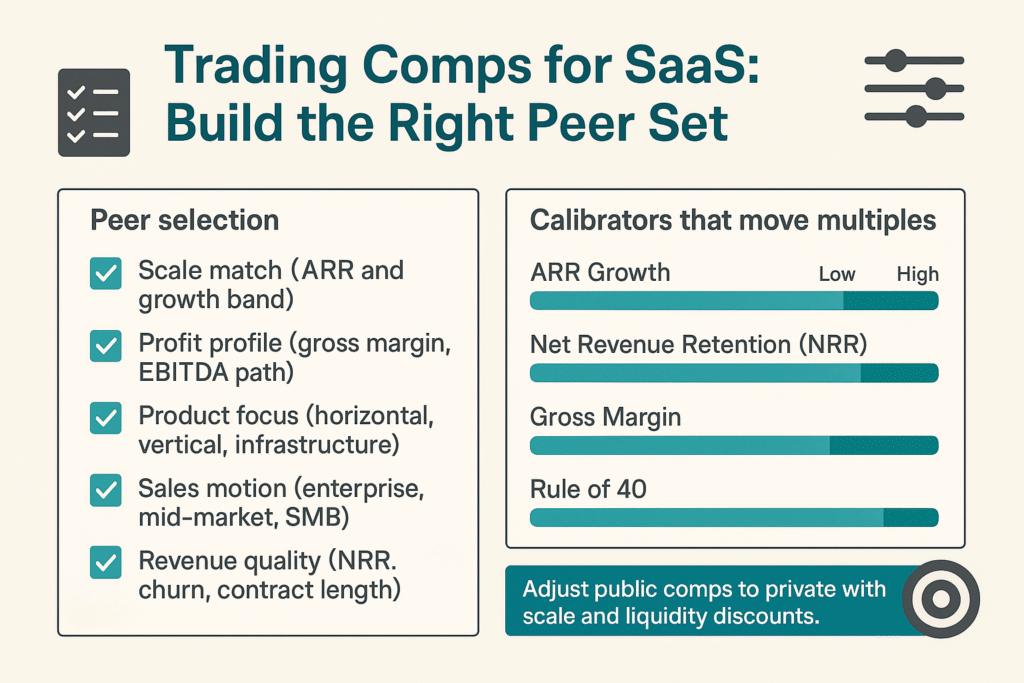
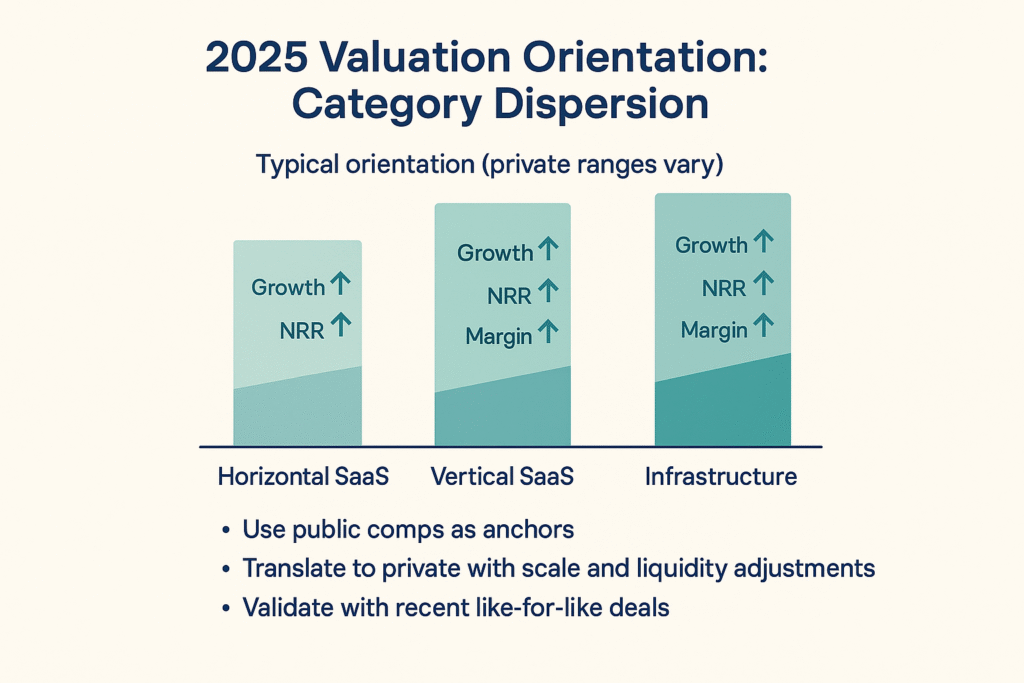
Comparable company analysis anchors banking valuation to current market evidence. Analysts form a tight peer group that matches scale, growth, margin, and product focus. They split peers into horizontal, vertical, and infrastructure because dispersion across groups is material this year. That split avoids misleading averages and sets a credible opening range.
Public references guide private pricing. Bankers adjust for scale, liquidity, growth durability, and gross margin quality when they translate public multiples to private banking valuation. These adjustments matter more than a single growth rate because they relate to risk and cash conversion.
Analysts rely on a few calibrators that move comps most. ARR growth sets the first band for revenue multiples. Net revenue retention separates sticky products from fragile products and drives expansion visibility. Gross margin signals reinvestment capacity and future cash creation. Rule of 40 links growth and margin and gives a quick quality score that investors use in 2025.
Market reads show clear dispersion by SaaS segment in 2025. Multiples differ across infrastructure, vertical, and horizontal categories because margin structures and durability differ. Banking valuation incorporates that segmentation to avoid apples to oranges peer sets.
Founders ask if there is a universal private range. Current indicators and meta-analyses show many private SaaS outcomes clustering roughly between three times and ten times revenue depending on quality. Banking valuation uses the band as context and then narrows it with true peers and live deals.
Precedent Transactions When Real Deals Matter Most
Precedent transactions give a live read on what buyers pay for assets that look like yours. Strong precedents share customer segment, average contract size, retention behavior, and margin band with the target. Timing matters because markets move during a year. Bankers give more weight to deals from the last twelve to twenty four months.
Analysts adjust transaction multiples before they apply them. Strategic buyers pay for synergies and road map fit that sponsors do not capture. Scale commands premiums because integration risk drops and cash conversion improves at size. Process dynamics like competition and speed also move outcomes. Banking valuation records these adjustments so boards see cause and effect.
To understand how process design increases price tension, read our playbook on attracting multiple buyers for an AI SaaS exit.
Reports that summarize deal activity help teams locate a practical range. They show buyer demand, quality filters, and median outcomes by profile. That context protects teams from cherry picking a trophy deal that does not map to the current asset. Banking valuation improves when every precedent has a stated similarity and a stated gap.
DCF for SaaS When Cash Flow Visibility Improves
A discounted cash flow estimates value from the cash a company will produce over time. Bankers use DCF when revenue visibility and margin stability are credible enough to forecast. Analysts then compare a comps range and a deals range against cash creation. That comparison shows whether the market price and the cash story align today.
Three inputs move the DCF most and deserve attention. The discount rate should reflect capital structure and risk rather than a copied peer number. The terminal value should match the long run growth profile of the served market. The churn and expansion assumptions should connect to cohort data and known go to market plans. These choices form the foundation of a defendable banking valuation.
AI economics now affect SaaS gross margin and cash paths. Inference and serving costs change unit costs at scale. Pricing and packaging need to align with usage and value so that expansion does not erode margin. Analysts model these costs explicitly inside projections for AI rich products in 2025. Banking valuation that reflects those costs earns trust with buyers.
For a deeper primer on AI margin modeling and unit economics, see our guide on AI SaaS valuation fundamentals.
Seven DCF mistakes bankers avoid
- Terminal growth that exceeds the long run growth of the served market.
- Discount rate that repeats a peer without matching risk and capital structure.
- Churn modeling that leaves cohort margins flat over time.
- Expansion rates that ignore required sales and success spending.
- Gross margin that excludes AI serving and model costs in production.
- Working capital that never changes with volume or contract terms.
- Sensitivity analysis that tests the wrong drivers and hides the right ones.
Avoiding these errors keeps the DCF consistent with how buyers think and improves banking valuation alignment with market ranges.
How Bankers Choose the Method by Situation
Bankers match the lead method to stage and evidence. Early stage companies with thin profit history lean on revenue based comps. Small assets sometimes use profit based screens as a cross check where buyers focus on cash payback. This avoids false precision and keeps banking valuation grounded in evidence.
Companies with five to twenty million in ARR benefit from a blended approach. Trading comps set a market range that everyone can test. Precedent deals show what buyers paid for similar profiles during the past year. A light DCF validates that cash creation supports the proposed range. That blend creates a cohesive banking valuation narrative.
Companies above twenty million in ARR with margin visibility use all three methods in full. Trading comps remain the opening view because buyers start there. Precedents provide buyer type and synergy context that explain why bids differ. DCF becomes a stronger voice since free cash flow predictability improves with scale. That triangulation reduces variance in banking valuation outputs.
AI focused products add one extra check during method selection. Teams include inference and serving costs inside gross margin in the model. Teams show how pricing and packaging offset those costs across cohorts. Teams connect usage growth to revenue quality and retention. That disclosure keeps banking valuation ranges realistic for AI heavy models.
Live Benchmarks Bankers Cite in 2025
Public software multiples vary by category this year. Horizontal, vertical, and infrastructure peer sets trade at different revenue and EBITDA bands. The differences reflect margin structure and durability by segment. Comps work only when the peer set matches the category correctly.
Private SaaS outcomes remain dispersed. Current sources that aggregate private outcomes show bands that often cluster near three to ten times revenue, depending on quality. Better retention, stronger gross margin, and cleaner financials move outcomes toward the upper half of the band. Banking valuation cites those bands as orientation and then narrows with peers and deals.
AI venture rounds remain elevated relative to M&A deals. Recent analysis shows median revenue multiples around twenty-five to thirty times in 2025 venture financings, with M&A prices below those levels because risk and synergy differ. Banking valuation treats those venture numbers as context rather than as targets for sale processes.
Rule of 40 remains a common quality screen among investors and bankers. The metric sums revenue growth rate and profit margin to form a benchmark. Analysts use it as a quick filter and not as a substitute for cohort health and cash flow analysis. Banking valuation treats the Rule of 40 as one input in a wider scorecard.
Prep Steps and Benchmarks for a Faster Review
Preparation reduces friction and saves time during banking valuation work. Start with ARR by product and region and confirm definitions across systems. Confirm net revenue retention by cohort and by segment. Confirm gross margin by product and include cloud and support costs. Confirm operating expenses by function and align them with the plan. This step reduces questions and accelerates analysis.
Build a tight peer universe that your banker and your board can support. Group peers by product type and sales motion and remove outliers that distort ratios. Remove peers with material hardware or services that change margins. Keep peers that match revenue quality and cash conversion. A better peer set strengthens banking valuation from the start.
Collect recent deals that mirror your profile and track why they apply. Note buyer types and synergy narratives that explain price. Note competition and timeline because process dynamics move outcomes. Record size, growth, retention, and margin for each transaction. This record lets you defend the banking valuation range in the first meeting.
Run a simple DCF that matches the plan and the cohorts. Use a discount rate that reflects capital structure and operating risk. Use a terminal framework that respects the served market. Model churn and expansion with observed cohorts and pipeline data. Include AI serving costs if your product uses models in production. Keep the DCF as a cross check rather than a replacement for the market.
Finish with a one slide summary that shows method, peer set, key drivers, risks, and the range. The slide should show how comps and DCF line up and where precedents sit. The slide should make the logic traceable to the inputs presented. That transparency increases confidence in your banking valuation during board and buyer reviews.
FAQ
What method do bankers use most for SaaS banking valuation
Teams start with trading comps to anchor the range to market prices, cross check with recent transactions that map to the profile, and add a DCF when cash flows are stable enough to forecast.
Why do asset based methods rarely fit SaaS banking valuation
SaaS businesses are asset light, so value sits in future subscription cash flows and retention durability rather than tangible assets. Bankers therefore favor market and cash based methods.
How do AI costs change banking valuation for SaaS
AI products introduce inference and serving costs that change gross margin. Pricing and packaging must cover those costs while supporting expansion. Analysts include those costs in DCF and in margin screens during comps work.
What is a reasonable private SaaS multiple in 2025 for banking valuation
Recent indicators show private outcomes that often cluster near three to ten times revenue depending on quality. Public peers and recent deals guide the opening view; buyer type and process dynamics shift the final price within that band.
Ready for a banker-style read on your number
Get a clear banking valuation range and a simple board slide that holds up in the room. Bookman Capital can help you choose the right methods and benchmark the right peers. Contact Bookman Capital at bookmancapital.io/ for a fast and credible review.
Sources: