
SaaS valuation depends heavily on one metric that founders often overlook—the churn and the exact churn rate formula you use to measure it. But what exactly are churn rates, and why do they matter? Simply put, churn rate measures the percentage of customers who cancel or stop using your SaaS product over a given period. Using the churn rate formula—customers lost ÷ customers at the start of the period × 100—helps keep reporting consistent across teams. It provides critical insight into customer retention and business health. We’ll reference the churn rate formula throughout this guide to tie retention directly to valuation.
Churn rates directly impact how much investors are willing to pay for your company. Companies with materially lower churn tend to command higher revenue multiples, all else equal; the exact premium varies by growth, margins, and rate environment.
The Churn-Valuation Connection That Most SaaS Founders Miss
Customer churn—measured consistently via the churn rate formula—affects SaaS valuation multiples more than most founders realize. Investors calculate your company’s worth using predictable revenue streams.
Low churn rates signal sustainable growth. High churn rates suggest fundamental problems with product-market fit.
Why Churn Reduction Significantly Boosts Customer Lifetime Value
Customer lifetime value increases dramatically with small churn improvements. Here’s a concrete example using the churn rate formula with monthly churn rates:
Applying the churn rate formula, a company with $100 MRR and 5% monthly churn yields an LTV of $2,000 per customer (assuming 100% gross margin). The same company with 4% monthly churn yields an LTV of $2,500 per customer. At a more realistic 72% gross margin, LTV shifts from $1,440 to $1,800 (+25%).
This substantial LTV increase influences revenue multiples, though the exact valuation impact varies by growth, margins, and market conditions. In simple terms, LTV ≈ (ARPU × gross margin) ÷ churn, where churn comes directly from the churn rate formula.
The Investor Psychology Behind Churn Obsession
Investors evaluate SaaS companies through risk assessment frameworks. Data rooms should state the exact churn rate formula you use and keep it consistent quarter to quarter. Churn data reveals how sticky your product truly is.
Due diligence teams examine cohort retention curves early and closely. They want to see flat or improving retention over time.
High churn rates indicate customers don’t find essential value in your product. This creates valuation discounts of 30-50%.
The Real Numbers: SaaS Churn Benchmarks That Define Your Worth
SaaS benchmarks vary significantly by company size and market segment. These benchmarks assume the standard churn rate formula for logo churn unless otherwise noted. Early-stage companies face different expectations than established players.
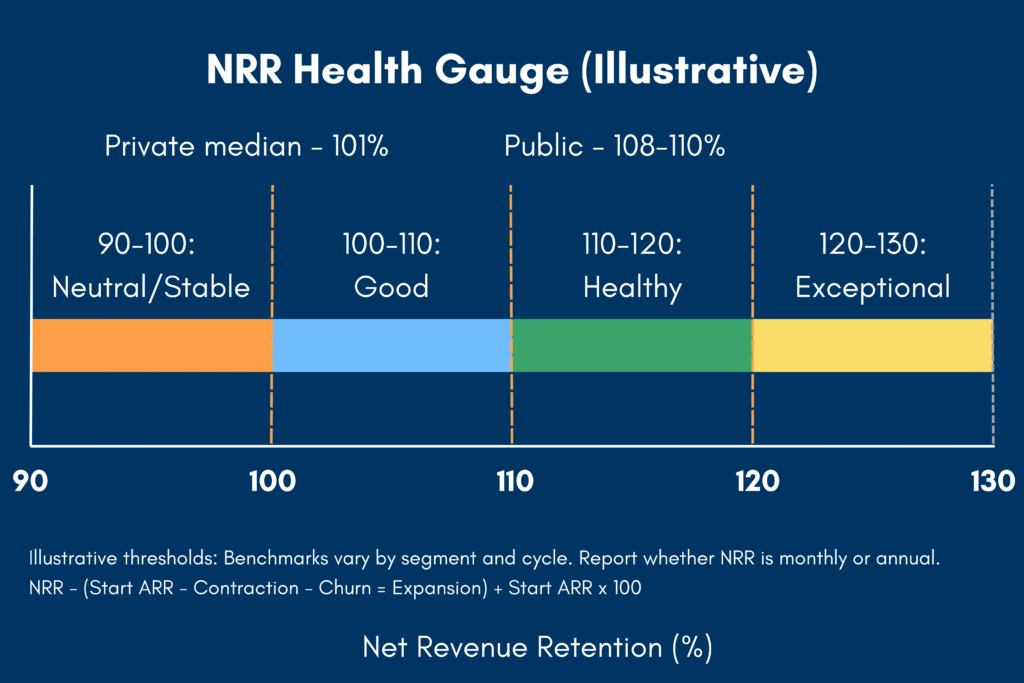
Across private B2B SaaS, median gross revenue retention is approximately 91% (equivalent to ~9% annual churn) and median net revenue retention is around 101%. Top-quartile NRR reaches approximately 109%. Public SaaS net dollar retention has stabilized around 108-110% recently.
Industry Benchmarks by Company Size
The following table provides illustrative ranges that vary by growth, margin, and rate environment. Public SaaS medians currently sit around 5-6× NTM revenue in 2024, with private deals typically below public comparables.
| ARR Stage | Acceptable Annual Churn | Excellent Annual Churn | Illustrative Valuation Multiple |
| $0-$1M | 10-15% | <8% | 2.5x-3.5x |
| $1M-$10M | 7-10% | <5% | 4.0x-5.5x |
| $10M+ | 5-7% | <3% | 5.5x-7.0x |
Note: Not rules, ranges vary with growth, margins, category, and rates. Use consistent logo or revenue-based formulas when you report.
Revenue Churn vs Customer Churn: Which Matters More
Revenue churn measures dollar value lost from departing customers. Customer churn counts the number of customers who leave. Customer churn uses the basic churn rate formula above, while revenue churn relies on MRR-based formulas.
Investors prefer companies with negative revenue churn. This means expansion revenue exceeds losses from departing customers.
Use NRR ≥110% as healthy and ≥120% as exceptional. Current medians sit around ~101% for private companies and ~108-110% for public companies.
Five Churn Killers That Investors Love to See
Churn reduction strategies deliver measurable improvements in customer retention. Track impact with a single, documented churn rate formula so results are comparable over time.These tactics directly impact SaaS valuations.
Successful implementation requires systematic approaches and consistent measurement. Random tactics produce inconsistent results.
1. Onboarding Optimization Blueprint
Time-to-value reduction prevents early churn. Customers who reach value quickly stay longer.
Successful onboarding achieves first value within 30 days. Companies track specific activation milestones throughout the process.
Automated workflows guide new customers through essential features. Personal touchpoints reinforce value at critical moments. Report early-life retention using the same churn rate formula you use for mature cohorts to avoid apples-to-oranges.
2. Predictive Churn Analytics
Machine learning models identify at-risk customers before they churn. Behavioral indicators reveal declining engagement patterns.
Early intervention can materially improve retention for at-risk accounts. Customer success teams receive automated alerts for immediate action.
Usage data feeds predictive models continuously. Systems improve accuracy over time through feedback loops.
3. Customer Success Automation
Automated touchpoints maintain consistent customer communication. Lifecycle campaigns deliver value at predetermined intervals.
Health scoring systems monitor account vitality automatically. Red flag triggers initiate human intervention when needed.
Scalable processes maintain personal feel while handling growth. Customer success becomes systematic rather than reactive.
4. Product Engagement Scoring
Feature adoption tracking reveals which capabilities drive retention. Power users consume specific feature combinations consistently.
Engagement scoring identifies customers approaching churn risk. Low scores trigger proactive outreach campaigns.
Product development teams use engagement data for roadmap decisions. High-retention features receive continued investment.
5. Retention Pricing Strategies
Pricing optimization reduces price-sensitive churn. Annual contracts lower churn rates compared to monthly billing.
Discount strategies for at-risk accounts preserve revenue streams. Win-back campaigns recapture recently churned customers.
Value-based pricing aligns costs with customer success metrics. Usage-based models grow with customer adoption.
The Valuation Math: How Churn Impacts Your Exit Multiple
Mathematical relationships connect churn rates to exit valuations. Because LTV often scales as (ARPU × gross margin) ÷ churn, your churn rate formula directly influences valuation math. Small churn improvements create substantial value increases.
Customer lifetime value calculations amplify churn improvements over time. The compounding effect grows significantly over 3-5 year periods.
Customer Lifetime Value Amplification
LTV calculations demonstrate churn’s financial impact. The relationship between churn and LTV is highly sensitive, though the translation to valuation multiples depends on various factors including growth rates and market conditions.
Lower churn correlates with higher revenue multiples, with the size of the premium depending on growth, margins, and the current rate environment. Public SaaS valuations have reverted toward historical norms (~5-6× NTM revenue in 2024), with private deals typically below public comparables.
Red Flags That Kill SaaS Deals (And How to Avoid Them)
Due diligence teams identify churn-related problems quickly. These issues can terminate acquisition discussions immediately.
Smart preparation addresses red flags before investor meetings. Proactive solutions demonstrate management competence.
Common mistakes include hiding seasonal patterns or presenting incomplete cohort data. Transparency builds investor confidence.
The Due Diligence Killers
Cohort analysis problems reveal data integrity issues. Investors expect clean, consistent retention reporting.
Seasonal churn spikes need clear explanations. Business model characteristics should justify timing patterns.
Customer concentration risks amplify churn concerns. Large customer departures create disproportionate revenue impact.
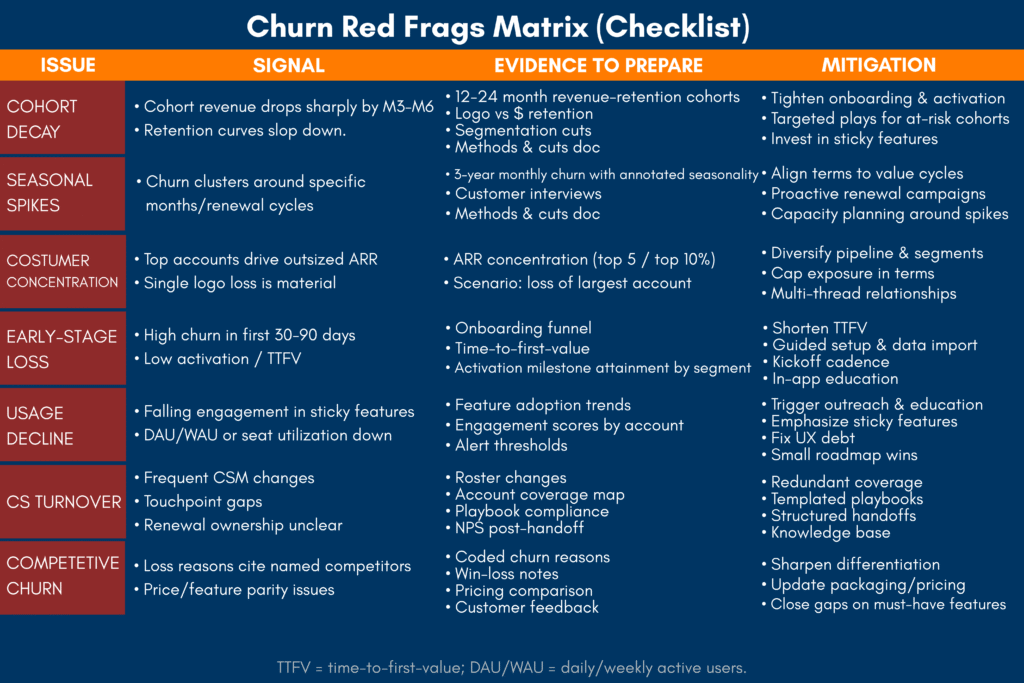
Early Warning Signs Investors Spot
- Increasing quarterly churn rates signal deteriorating product-market fit
- High early-stage customer loss indicates onboarding problems
- Negative cohort retention curves show systematic value delivery failures
- Product usage decline correlates strongly with upcoming churn events
- Customer success team turnover disrupts relationship continuity
- Competitive churn attribution reveals differentiation weaknesses
- Inconsistent or undefined churn rate formula (e.g., switching denominators or periods between reports).
Recovery strategies exist for each red flag situation. Systematic approaches address root causes rather than symptoms.
Implementation timelines typically require 6-12 months for measurable improvements. Investors appreciate honest timelines over optimistic projections.
Building Your Churn-Proof Valuation Strategy for 2025
Forward-thinking SaaS companies don’t treat churn as a side project—they build it into the way they grow. The aim is simple: make revenue steadier month after month so the future looks less uncertain. When investors believe your revenue will keep showing up, they value the business more generously.
Start by agreeing on what churn means in your company and write it down in plain language. Use one churn rate formula, state the time period you’re measuring, and be clear about whether you’re counting customers or dollars. When everyone uses the same definition—in product, success, finance, and the boardroom—your reports stop arguing with each other and start telling one story.
Next, shorten the path from sign-up to the first real win. The faster a new customer experiences clear value, the less likely they’ll leave. Teach them the few behaviors that lead to long-term success, and check in when activity drops or key steps stall. A short, friendly message at the right moment often prevents a cancellation later.
Keep pricing and packaging on the customer’s side. Make renewals straightforward, avoid surprises, and give people an easy path to grow as they find more value. When you do need to save an at-risk account, offer help and options that match their situation instead of pushing a one-size-fits-all discount.
Turn feedback into fixes. The questions support teams hear every day should guide your product tweaks, help articles, and onboarding flows. Close the loop by telling customers what changed and how it makes their lives easier. Over time, small improvements add up to fewer reasons to leave.
Track progress in one simple view that shows churn, expansion, and overall net revenue retention. Meet regularly, look for patterns by plan or segment, and assign clear owners. A steady cadence beats sporadic heroics because it creates habits that stick.
Finally, tell the story in human terms when you talk to investors. Explain how a single definition of churn improved reporting, how faster time-to-value reduced early drop-off, and how proactive outreach cut preventable cancellations. In 2025, markets reward calm, predictable revenue. A clear definition, consistent measurement, and a simple operating rhythm turn your retention work into a credible valuation story.
The 90-Day Quick Wins
- Immediate improvements create momentum for longer-term initiatives. Quick wins demonstrate management execution capability.
- Cohort analysis setup provides baseline measurement capabilities. Customer feedback systems identify improvement opportunities immediately.
- Onboarding optimization delivers results within one quarter. Customer success automation reduces manual workload while improving outcomes.
- Publish a one-pager in your data room that spells out your churn rate formula (logo and revenue) and sample calculations.
Frequently Asked Questions
What churn rate do investors consider “good” for a SaaS company?
Using the standard churn rate formula, annual customer churn below 5% ranks as excellent for B2B SaaS companies. Rates between 5-7% meet acceptable standards. Revenue churn should trend negative through expansion revenue.
How much can reducing churn actually increase my company’s valuation?
Lower churn correlates with higher revenue multiples, though the exact premium varies by growth, margins, and rate environment. The relationship is positive but not universally quantifiable.
Should I focus on customer churn or revenue churn when presenting to investors?
Both metrics matter, but revenue churn impacts valuations more directly. Negative revenue churn through customer expansion creates particularly strong investor appeal.
How quickly can churn reduction efforts show measurable results?
Basic improvements appear within 3-6 months of implementation. Sustainable churn reduction requires 6-12 months to demonstrate consistent patterns.
What’s the biggest churn-related mistake SaaS founders make during fundraising?
Missing cohort data represents the most common error. Founders also hide seasonal patterns instead of explaining them with business context. Always be explicit about whether you’re discussing monthly vs annual churn rates and the exact churn rate formula used.
Who can help me apply the churn rate formula, benchmark churn, and turn it into a valuation story for investors?
Bookman Capital’s M&A team. They’ll help you standardize your churn rate formula, build clean GRR/NRR and cohort analyses, map churn reductions to LTV/CAC and NTM multiple scenarios, and prep a diligence-ready data room.
Long-term Valuation Positioning
- Strategic initiatives build sustainable competitive advantages. Product development focuses on high-retention features.
- Customer success becomes a revenue center rather than cost center. Expansion revenue programs reduce net revenue churn below zero.
- Data-driven decisions replace intuition-based retention strategies. Measurement systems track progress consistently over time.
- Investor communication emphasizes churn improvements alongside growth metrics. Balanced scorecards demonstrate operational excellence.
- SaaS valuations will continue rewarding companies with exceptional retention. Market dynamics favor sustainable growth over rapid scaling.
Ready to optimize your churn strategy for maximum valuation? Bookman Capital’s M&A experts help SaaS founders prepare for successful exits. Get your complimentary valuation assessment at bookmancapital.io/ and discover how reducing churn could add millions to your exit value.
Sources:
- Private saas benchmarks, median grr, nrr, public ev/ntm revenue multiples, rule of 40, cac payback, sales efficiency, burn multiple, valuation dispersion, pipeline coverage
- Public saas net dollar retention (ndr), ev/revenue, ev/fcf multiples trends, best in class retention, growth vs fcf, software index updates, category comps
- Churn rate formula, logo vs revenue churn, negative revenue churn, ltv formula, ltv/cac ratio, cohort analysis, retention curves, activation milestones, time to first value, mrr components