
The history of business valuation is a story of tools, ideas, and markets evolving together from analog slide rules and rule-of-thumb multiples to spreadsheet-driven DCFs and, today, SaaS-native metrics. Understanding the history of business valuation isn’t trivia; it’s a practical map for choosing the right method in 2025. Pick an approach misaligned with your business model and you can materially understate value during fundraising or strategic discussions. Pick one grounded in the discipline’s history and you’ll speak investors’ language with a defensible, comparable number.
This guide follows the history of business valuation chronologically, the CAPM and cost of capital, the spreadsheet revolution, the dot-com boom and bust, subscription economics, PLG metrics, and the recent AI shift then closes with a short “applied today” section for software and AI founders. Along the way, you’ll see how investment bankers, private equity firms, and venture capitalists adopted (and adapted) methods as markets changed.
What Is a Slide Rule?
A slide rule is a mechanical, analog calculator. Using logarithmic scales that slide past each other, it performs multiplication, division, roots, powers, and logs by adding distances, delivering fast, approximate results long before electronic calculators and spreadsheets. In the history of business valuation, slide rules were the everyday tool of bankers and analysts, enabling the arithmetic behind income capitalization and early multiples. Until the late 1960s, practitioners routinely relied on slide rules to speed valuations when computers were not yet available.
Why Looking Backward Helps You Move Forward
Most founders jump straight to “What’s my company worth?” without asking “How should we calculate that?” The history of business valuation shows that methods carry built-in assumptions: stability, growth visibility, cost of capital, or comparable markets. A PE firm may anchor on EBITDA and cash conversion, while a VC looks to ARR growth, NRR, and burn efficiency. Those lenses can yield materially different ranges.
Knowing the lineage of each approach gives you negotiating power and process control. 409A valuations require specific conventions; bankers cross-check DCF with public comps and precedents; VCs triangulate with round-by-round comparables and market size. When you understand where each method came from and what it assumes, you select methods for fit, not habit.
Valuation Basics in One Page
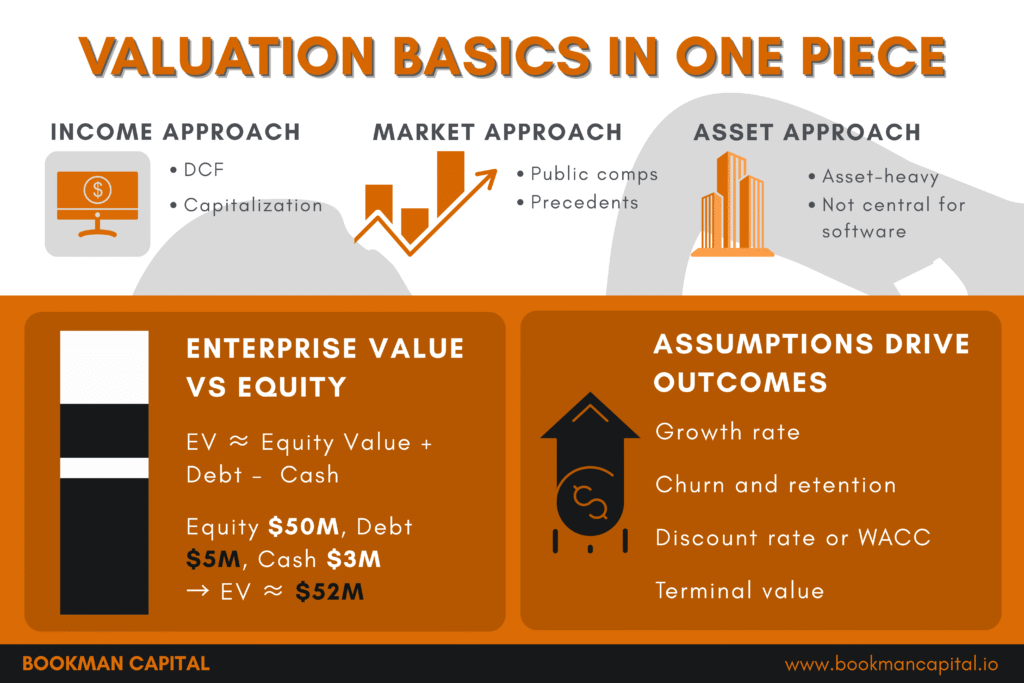
Valuation answers what a business is worth today, typically via three families of methods:
- Income Approach: Value as the present value of future cash flows e.g., Discounted Cash Flow (DCF) or capitalization of earnings.
- Market Approach: Value inferred from comparable public companies, precedent transactions, or financing rounds (multiples are “implied DCFs” the market is currently paying).
- Asset Approach: Value of net assets are useful for asset-heavy firms; rarely central for software.
Enterprise Value (EV) vs Equity Value: EV ≈ equity value + debt − cash (an operating value independent of capital structure). Equity value is what shareholders own after those adjustments.
Quick example: If equity value is $50M, debt $5M, and cash $3M, then EV ≈ $52M. Always confirm which figure a counterparty is quoting.
All models are assumption engines. Small changes in growth, churn, discount rates, or terminal value can swing outcomes. Treat outputs as ranges, not points.
A Brief Timeline of the History of Business Valuation (1900–2025)
- 1900–1930s: Book value and liquidation value dominate conservative lending; simple earnings and dividend yields appear in markets.
- 1930s–1950s: Income capitalization formalizes; dividend discounting (Gordon–Shapiro) spreads in academia and practice.
- 1960s: CAPM and cost of capital provide a theory for required returns; WACC logic takes shape.
- 1970s–1980s: Personal computing + spreadsheets move DCF from theory to daily practice.
- 1995–2003: Dot-com exuberance; then reversion to fundamentals (cash flow and unit economics).
- 2004–2014: Subscription economics; ARR/MRR, public SaaS comps, cohort analysis.
- 2015–2019: PLG, the Rule of 40, NRR, and CAC payback become common shorthand.
- 2020–2025: Zero rates turbocharge multiples, repricing tests durability, and AI introduces compute-driven margin dynamics.
Pre-1970s: Rules of Thumb, Income Capitalization, and Early Dividend Models
Before widespread computing, practitioners needed methods that were fast and explainable. In the history of business valuation, slide rules and desk calculators made capitalization of earnings (or simple multiples) the practical default: observe earnings, apply a rate, and sense-check with book value or collateral. Dividend discounting advanced the idea that a stock equals the present value of future distributions, but private deals often stuck to pragmatic earnings-based heuristics.
Implication today: For small, profitable SaaS with predictable cohorts and ~20% growth, a streamlined capitalization or revenue multiple can still be appropriate—especially where speed and defensibility matter more than theoretical elegance.
1960s: Modern Finance Emerges—CAPM and Cost of Capital
The 1960s brought a conceptual leap. The Capital Asset Pricing Model (CAPM) linked expected return to systematic risk, giving analysts a way to estimate the required return on equity. In practice, that meant discount rates could be justified with more than rules of thumb. As corporate finance matured, the idea of a blended weighted average cost of capital (WACC), mixing the costs of debt and equity became standard input for DCF models.
1970s–1990s: The Spreadsheet & DCF Revolution
The arrival of VisiCalc (1979) and Lotus 1-2-3 (1983) turned valuation into scenario analysis. With spreadsheets, DCF leapt from academia to boardrooms: forecast cash flows, apply a risk-appropriate discount rate, and estimate terminal value. By the late 1980s and early 1990s, banks paired DCF with public comparables and precedent transactions, while private equity popularized a focus on cash conversion and debt capacity.
Where DCF shines: predictable, recurring cash flows; strategic buyers modeling long-term value capture; multi-year contracts offering genuine visibility.
Where DCF struggles: early stage volatility; terminal value dominating the math; young AI businesses with margin structure still forming.
1995–2003: Dot-Com Euphoria and the Return to Fundamentals
The internet boom encouraged valuation by usage metrics (page views, registrations) and growth at all costs. The bust (2000–2003) forced a reset: investors re-anchored on unit economics (CAC, LTV, churn) and the credibility of cash flow. The lesson that endures in the history of business valuation: growth without retention and margin discipline does not compound value.
2004–2014: Subscription Economics and Comparable Public SaaS
As subscription software matured, investors needed a common language to compare models with recurring revenue and long-lived cohorts. ARR/MRR became the preferred way to express top line, and public SaaS names created a robust set of EV/Revenue comparables. Cohort analysis and retention curves moved from niche to normal, letting analysts judge quality of revenue, not just quantity. Multiples functioned as implied DCFs: growth, margin, and durability compressed into a single market ratio.
2015–2019: PLG, Rule of 40, and the Metric-Led Era
The mid-to-late 2010s cemented a fast, comparable shorthand for quality:
- Rule of 40 (growth % + margin %) to balance momentum with discipline.
- NRR (Net Revenue Retention) to measure expansion minus churn and the compounding power of cohorts.
- CAC Payback (months to recover acquisition spend) to signal capital efficiency; LTV:CAC to sanity-check profitable growth.
These didn’t replace DCF or comps, they informed them. They also made valuation narratives more transparent for boards and buyers.
2020–2025: Zero Rates, Repricing, and the AI Shift
Extraordinary monetary policy in 2020–2021, a singular episode in the history of business valuation, compressed discount rates and supported elevated revenue multiples across growth equities. From late 2021 through 2023, rate normalization and risk repricing brought markets back to fundamentals by spotlighting gross margin, retention, and cash efficiency. Meanwhile, AI added new wrinkles to the history of business valuation: usage-based compute costs that pressure margins, the valuation of data moats, and debates over open vs. closed model defensibility.
Picking Methods the Historical Way
- Limited visibility (early stage, volatile cohorts): Anchor on market evidence—round-by-round comparables and public comps; treat cash-flow models as directional.
- Emerging predictability (stabilizing cohorts, improving margins): Lead with market multiples; use DCF as a cross-check once your forecast accuracy improves.
- Predictable cash flows (multi-year contracts, consistent retention): Run a full DCF supported by comps/precedents; communicate a range, not a false-exact point.
- 409A & compliance: Use accepted income/market approaches and document assumptions; independent appraisals are common for safe-harbor.
8 Pivotal Milestones in the History of Business Valuation
- Dividend Discounting (1950s): Gordon–Shapiro formalizes present-value thinking for equity.
- CAPM (1960s): A theory of required return brings rigor to discount rates.
- WACC in Practice (1970s): Cost of capital becomes an operational input for models.
- Spreadsheets (1979–1983): VisiCalc and Lotus 1-2-3 make DCF a daily tool.
- Dot-Com Reset (2000–2003): Markets return to cash flow and unit economics.
- Public SaaS Benchmarks (2004–2014): EV/Revenue comps and cohort analysis normalize.
- Metric-Led Valuation (2015–2019): Rule of 40, NRR, CAC payback, and LTV:CAC spread.
- AI Era (2020–2025): Compute economics, data moats, and defensibility come to the fore.
Era to Method Map
| Era | Dominant Methods | Typical Inputs | Primary Tools/Practices |
|---|---|---|---|
| 1900–1950s | Income capitalization, book/liquidation value, simple multiples | Reported earnings, tangible assets, dividend yields | Slide rules, desk calculators; banker heuristics |
| 1950s–1960s | Dividend discounting; early income models | Dividend growth, payout stability, risk awareness | Gordon–Shapiro logic; academic adoption |
| 1960s | Required return theory (CAPM) → discount rates | Market risk, beta concepts, risk-free rates, equity risk premia | Cost of equity formalization; cost-of-capital thinking |
| 1970s–1990s | DCF + WACC; comps and precedents gain prominence | Multi-year cash-flow forecasts, discount rates, terminal value | VisiCalc/Lotus → Excel; banker toolkits; scenario analysis |
| 1995–2003 | Usage metrics (boom), return to fundamentals (bust) | Traffic/signups → then CAC/LTV, churn, margin | Post-bubble discipline; cohort thinking emerges |
| 2004–2014 | Public SaaS comps; EV/Revenue; cohort analysis | ARR/MRR, retention, expansion, contract length | Comparable sets; cohort tables; EV/Revenue benchmarking |
| 2015–2019 | Metric-led triangulation | Rule of 40, NRR, CAC payback, LTV:CAC | Operator dashboards; board-level shorthand |
| 2020–2025 | Fundamentals + AI nuance | Gross margin under compute, data moats, distribution leverage | Efficiency metrics; FinOps; defensibility narratives |
FAQs
Is DCF outdated for SaaS?
No. DCF is powerful when cash flows are predictable. For earlier stages, market evidence (comps and financings) often communicates better, with DCF used as a cross-check.
Why does the Rule of 40 still matter?
It blends growth and efficiency in one number and often correlates with healthier financing dynamics and stronger multiples. It’s a shorthand, not a law.
Do revenue multiples “replace” DCF?
No. Multiples are implied DCFs. They compress assumptions about growth, margin, and durability into the price peers and buyers actually pay.
How do investors handle AI companies with high compute costs?
They adjust for gross-margin pressure, assess inference efficiency and model performance, and price defensibility (data moats, workflow lock-in, distribution).
What’s the practical difference between banker, PE, and VC methods?
Bankers: public comps/precedents + DCF for IPO/M&A readiness. PE: EBITDA, cash conversion, downside. VC: growth, NRR, CAC payback, market size, round-by-round comparables.
How often should we refresh our valuation?
At least annually for 409A; refresh ahead of fundraising, major hiring waves with options, or material changes in margin, concentration, or trajectory.
Start Your Valuation Readiness Today
The history of business valuation tracks a steady arc: from analog rules to spreadsheet rigor to today’s SaaS-native metrics and AI-era nuances. Each era added tools, but none erased the prior ones; they clarified when each method fits. Early stages lean on market evidence; predictable cash flows invite full DCF; and triangulation across methods rather than false precision, builds credibility.
Ready to translate history into a defensible valuation for your software or AI company?
Get Bookman Capital’s Valuation Readiness Checklist and schedule a consult. We’ll identify the method mix that fits your stage and highlight the two fastest levers to strengthen your narrative before you step into investor conversations. Visit bookmancapital.io to connect with Bookman Capital and position your company with a valuation investors can trust.
Sources:
- “1960s: CAPM and cost of capital provide a theory for required returns” → CAPM links expected return to systematic risk (beta) and the risk‑free rate/market premium.
- “1930s–1950s: Income capitalization formalizes; dividend discounting (Gordon–Shapiro) spreads” → Equity value as the present value of expected future dividends, including the familiar constant‑growth form.
- “WACC logic takes shape” / “Income Approach (DCF)” → Cost of capital defined as a weighted average of the costs of debt and equity and used as the discount rate in valuation.